Environmental Analytics​

The Environmental Analytics app assists in analyzing your building’s performance by utilizing indoor environmental metrics data collected from available sensors. These insights are obtained from sensors integrated into the networking and collaboration infrastructure across your buildings within your network.​

Use Cases & Value

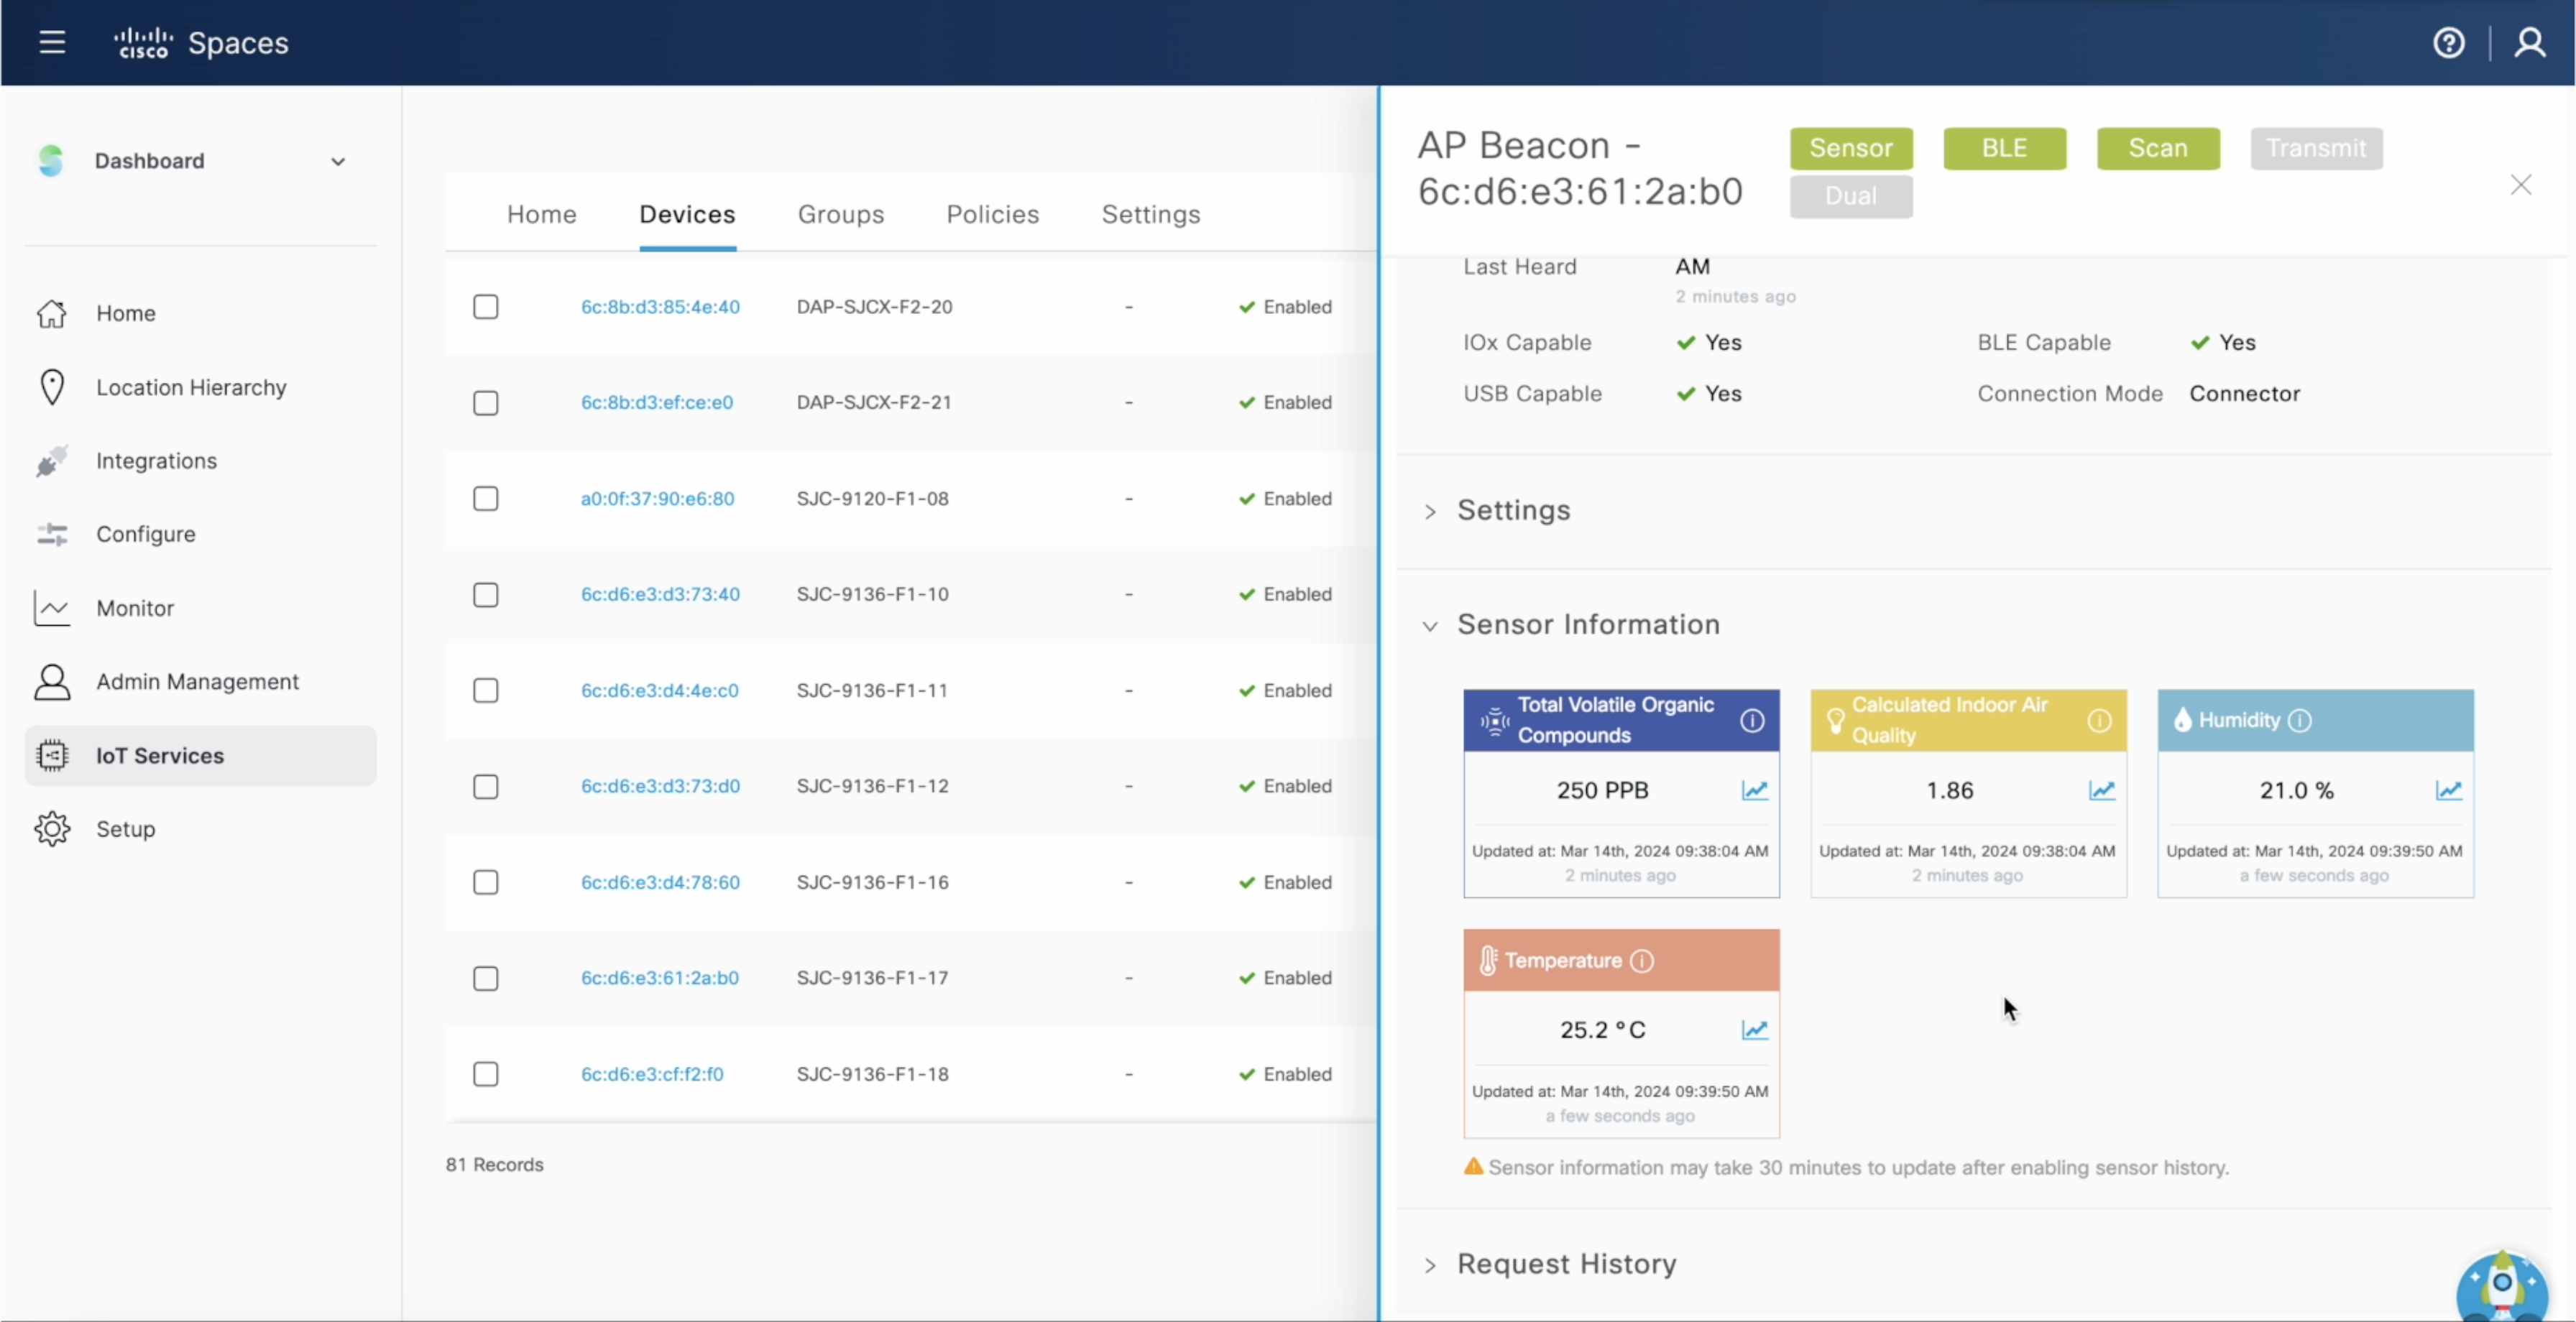
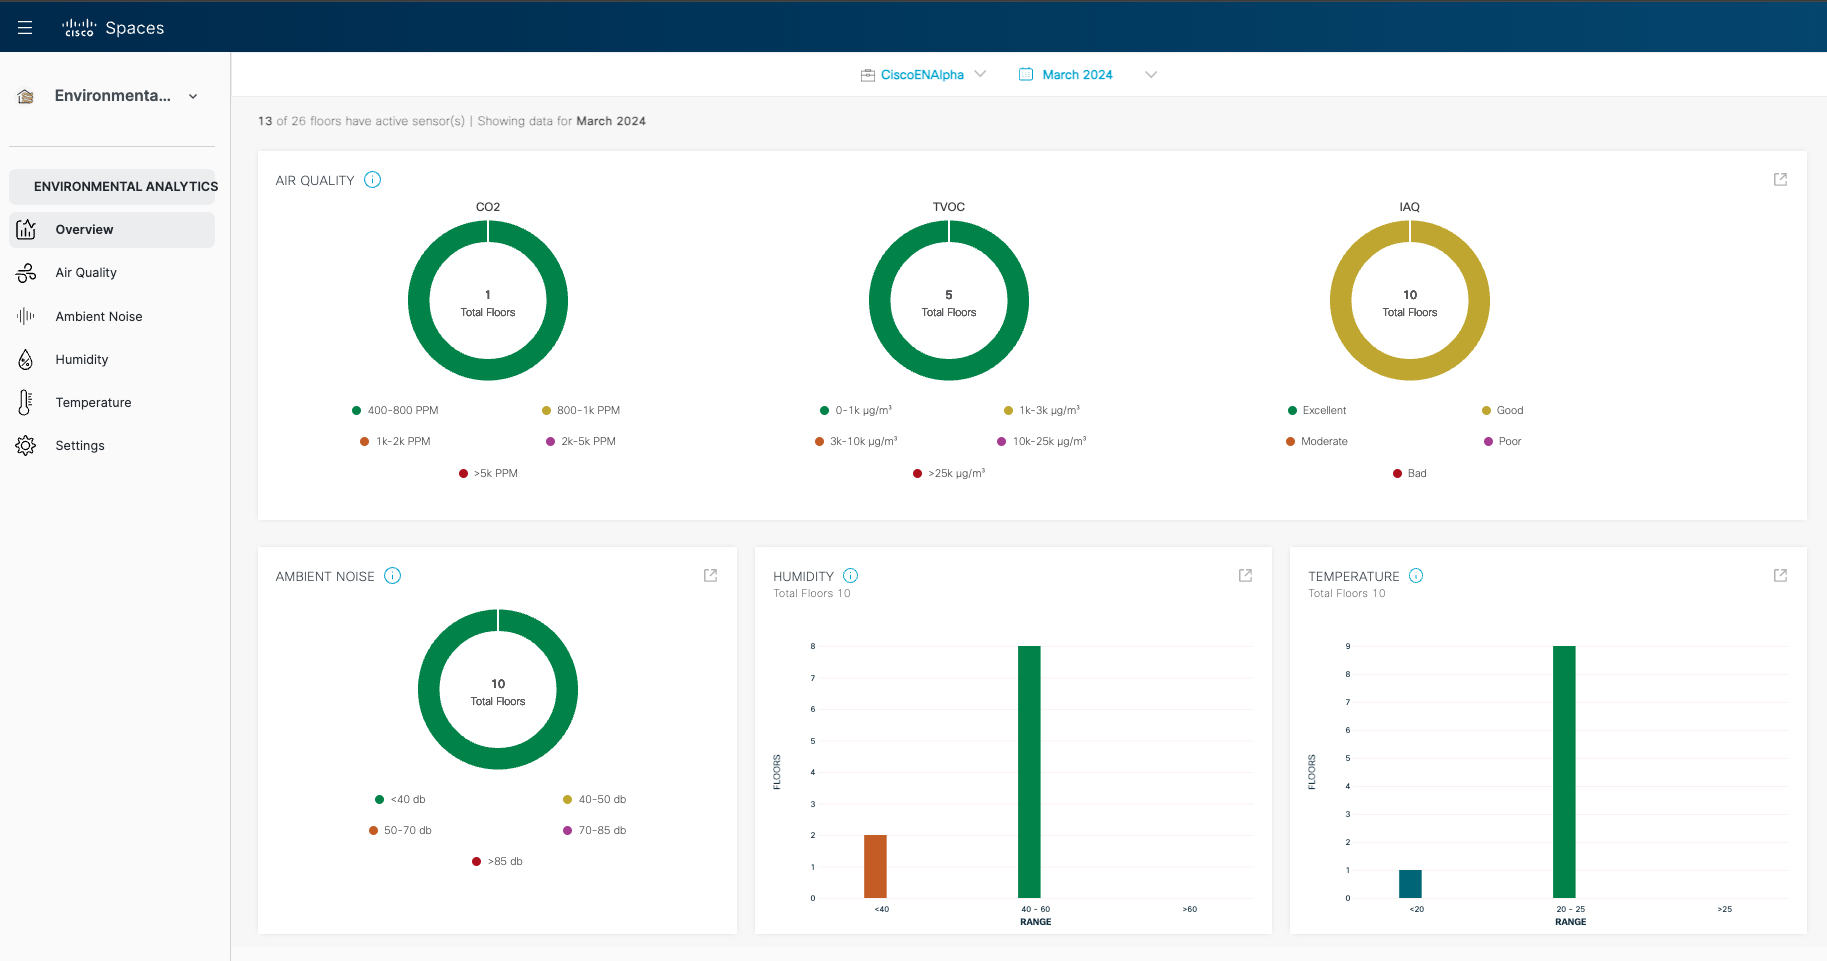
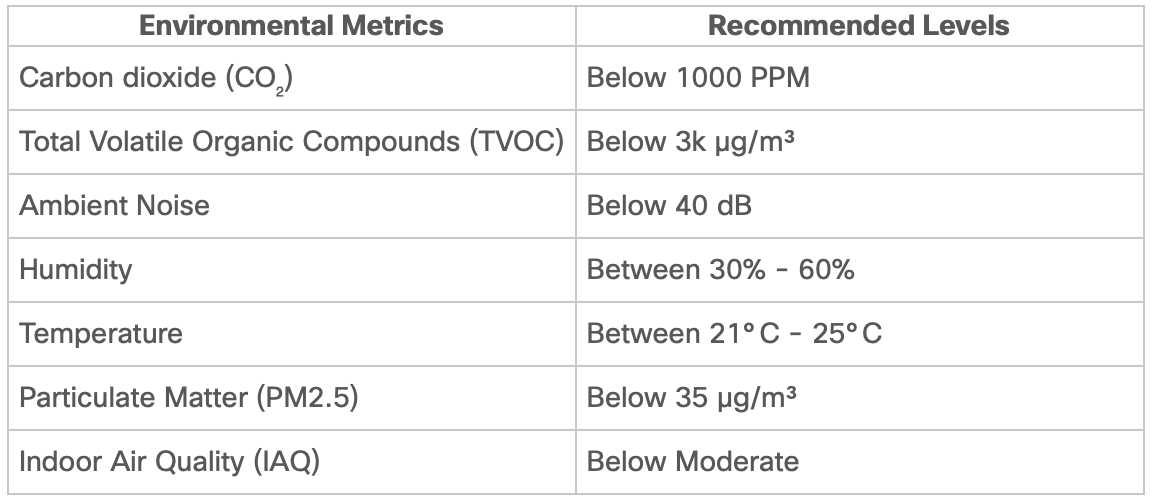
Measure and analyze environmental data, including carbon dioxide (CO₂), particulate matter (PM2.5), total volatile organic compounds (TVOCs), ambient noise, temperature, and relative humidity to implement necessary corrective actions as needed.​

Floor View​​

Provides insights into your building’s performance with historical data and trends about specific hours and days.​

Value Delivered:

Gain insights into the buildings and floors in your portfolio that exhibit the most significant deviations across all indoor environmental metrics. ​

  • Drill into each floor to examine maximum, minimum, and average levels over time, pinpointing days when building controls were not optimized for specific conditions.
  • Analyze cumulative time spent out of the ideal range to assess the extent of issues and potential improvements in incident resolution time.
  • View average data to evaluate whether building controls maintain ideal conditions consistently throughout various times and days of the week.

Useful to: Facilities and IT​​

Floor Comparison

See multiple floors ranked by their average, minimum, and maximum values or cumulative time spent by all sensors on the floor that were outside of the ideal range. ​

Value Delivered:

  • Compare floors based on their deviation from the recommended levels, ranking them to identify those with the most significant outliers compared to the ideal measurement ranges. This allows you to view the maximum and minimum deviations, helping to pinpoint floors with the most pronounced deviations.
  • Access a ranked view of cumulative time spent out of the ideal range across all sensors per floor, providing insights into areas where resolution time can be improved.

Useful to: Facilities and IT​​

Export to CSV​​

Get a 10 minute average (day trendline) or a daily average (month trendline) of every room or sensor on the floor.​

Value Delivered:

  • Easily download your environmental sensor data to archive and analyze it at any time.
  • Combine with other datasets in your analytical tool of choice.

Useful to: Facilities and IT​

Customers should have purchased or in a trial of ACT or Spaces Unlimited Licenses. ​

  • Have an account provisioned on the Cisco Spaces platform. If you don’t have an active account, please email spaces@cisco.com
  • Create user account – Accept invitation from Cisco Spaces & setup password​​

The setup process is an integration of multiple sensors into the Cisco Spaces platform (Meraki, Webex, Catalyst and 3rd party sensors)​

Note: Meraki Things environmental sensors (MT10, MT14, and MT15) must be connected through a Bluetooth Gateway (MR or MV).

  • Setup Meraki API Integration with Spaces – Here are the steps for Meraki API Key Method
  • If your API Key has read/write permissions, then the MQTT Broker will be configured automatically.
  • If your API Key is read-only, please reach out to Cisco Spaces Support to request authentication credentials to finish setup.
    • Log into the Meraki Dashboard
    • Setup MQTT brokers for MT (Meraki Things)
    • Click on Sensors > MQTT brokers. Select the MQTT broker (Host: mqtt.dnaspaces.io and Port: 1883) to publish to. You can also Add and Edit the broker.
  • Place Meraki Things devices on the network map in Meraki Dashboard – Placing Devices on the Map in Dashboard
  • Wireless IoT Services Activation involves pushing settings to
    • Connector
    • Controller
    • APs

    All these 3 of your infrastructure elements need to be up and running for you to proceed with IoT Services deployment.

  • You can check if you meet all pre-reqs from Menu > IoT Services > About IoT Services.
    • If you meet all Pre-requisite checks your check-list will look like this
    • If don’t meet any of the Pre-requisite, You’ll see a Cross next to the item that you need to fix

Note: Please make sure all pre-requisite checks are met to deploy IoT Services

  • Navigate to ‘About IoT Services’ page on the left-hand side of the Menu > IoT Services.
  • On your Day 0 of your IoT Services Activation you’ll see an Amber Banner at the top that signals that you haven’t started your deployment yet.
  • Once you meet all the prerequisites, go ahead and Click on the “Activate” button on the Amber Banner. You can also click on “Activate IoT Services” to begin.
  • Select ‘Wireless’ and Click on ‘Next’.
  • After a quick Prerequisite Check Screen it progresses to Activation Screen that shows how many Connectors and Controllers are up.
  • Post Activation Summary Screen, there are two ways to deploy IoT services.
a. Deploy IoT Services across ALL active devices

You can either deploy IoT Services across all locations and Access Points

  • Click on ‘Activate’ Button, to activate across all Connectors and Access Points
  • The Activation Initiation page shows the approximate amount of time it would take to deploy
b. Deploy IoT Services on selected connectors and access points


You can Also do a Customized deployment only on selected Connectors and Access Points by Clicking on ‘Click here for customization’

  • ‘Choose’ the connectors that you would like to activate IoT Services for and click on ‘Activate’
  • Activation Initiation Page shows you the Approximate amount of time needed to push the settings across Controllers, Connectors and Access points.
  • Once the Connector is activated, Click on ‘Activate Wireless Gateway’ and
  • ‘Select’ the APs that you want to install:
    • i) APs capable of Advanced Gateway will be installed with Advanced AP Gateways/li>
    • ii) APs can be filtered by location from Location Hierarchy dropdown at the top.
    • iii) A Summary on the right shows the number of APs you selected
  • Click ‘Next’ to install the APs you have selected
  • Screen Showing Approximate time it would take to deploy would appear

  • Under IoT Services, Click on the Device Management tab
  • At the top, Click on the tabs Devices > AP Beacons
  • Click on AP Sensors, this populates all the APs that are available to be enabled as a sensor
  • Click on the AP that you want to be enabled as a sensor
  • A page on the right opens up, Navigate to “Settings” dropdown
  • You are given two options either to enable or disable BLE radio or to enable or disable the BLE Sensor
  • Click on the option Sensor to enable the sensor on the selected AP, The option needs to be turned on. The action gets queued in your system and should take a few seconds to enable the sensor.
  • Verify if the AP as a sensor is working. Close the page on the right and Click on the AP where the sensor was enabled.
  • Navigate to Sensor Information, Click on the dropdown and verify if all the metrics are populated.
  • Now these metrics can be used to monitor temperature, humidity, Indoor Air Quality and TVOC in the Environmental Analytics App.​
  • Wireless IoT Services Activation involves pushing settings to
    • Connector
    • Controller
    • APs

    All these 3 of your infrastructure elements need to be up and running for you to proceed with IoT Services deployment.

  • You can check if you meet all pre-reqs from Menu > IoT Services > About IoT Services.
    • If you meet all Pre-requisite checks your check-list will look like this
    • If don’t meet any of the Pre-requisite, You’ll see a Cross next to the item that you need to fix

Note: Please make sure all pre-requisite checks are met to deploy IoT Services

  • Navigate to ‘About IoT Services’ page on the left-hand side of the Menu > IoT Services.
  • On your Day 0 of your IoT Services Activation you’ll see an Amber Banner at the top that signals that you haven’t started your deployment yet.
  • Once you meet all the prerequisites, go ahead and Click on the “Activate” button on the Amber Banner. You can also click on “Activate IoT Services” to begin.
  • Select ‘Wireless’ and Click on ‘Next’.
  • After a quick Prerequisite Check Screen it progresses to Activation Screen that shows how many Connectors and Controllers are up.
  • Post Activation Summary Screen, there are two ways to deploy IoT services.
a. Deploy IoT Services across ALL active devices

You can either deploy IoT Services across all locations and Access Points

  • Click on ‘Activate’ Button, to activate across all Connectors and Access Points
  • The Activation Initiation page shows the approximate amount of time it would take to deploy
b. Deploy IoT Services on selected connectors and access points


You can Also do a Customized deployment only on selected Connectors and Access Points by Clicking on ‘Click here for customization’

  • ‘Choose’ the connectors that you would like to activate IoT Services for and click on ‘Activate’
  • Activation Initiation Page shows you the Approximate amount of time needed to push the settings across Controllers, Connectors and Access points.
  • Once the Connector is activated, Click on ‘Activate Wireless Gateway’ and
  • ‘Select’ the APs that you want to install:
    • i) APs capable of Advanced Gateway will be installed with Advanced AP Gateways/li>
    • ii) APs can be filtered by location from Location Hierarchy dropdown at the top.
    • iii) A Summary on the right shows the number of APs you selected
  • Click ‘Next’ to install the APs you have selected
  • Screen Showing Approximate time it would take to deploy would appear
Post Deployment you can check the status of deployment from ‘Activation Status’ section on “About IoT Services” page.

  • If you wish for a detailed status of deployment you can click on ‘View detailed status’ to understand which components have failed.
  • If you wish to troubleshoot this further you can click on ‘Troubleshoot’

  • Visit the IoT Device Marketplace to learn about devices recommended to be used by Cisco Spaces.
  • Navigate to IOT Services > Device Management
  • Select ‘Onboard Devices’ from the main page
  • Select ‘Floor Beacons’
  • Enter your Order ID
  • Your BLE Devices will now be visible under Device Management > Claimed Beacons
Enables devices in Webex Control Hub to send data such as people count, temperature, air quality, etc. in real-time to Cisco Spaces.

  • Locations and Floors help categorize Workspaces based on their physical addresses. This enables devices to be hierarchically organized for easier management, and later assignment in Cisco Spaces.
  • Log into Webex Control Hub
  • Enter your Control Hub Org email ID to sign in.
  • In Control Hub, choose Management > Locations
  • Create a new location by clicking on Manage Locations > Create Manually
  • Creating locations will make auto-assigning Workspaces on the Spaces platform easier later
  • The creating a location window will be displayed to define logical names for your locations. Create a new location by filling in all the required info and pressing Create
  • After the location is created, floors can be added to add more levels to the hierarchy by clicking on Add Floors
  • Assign a logical name/description to your floors and click Add
  • Once created, in the Overview tab, you can view the floor assigned to your defined locations.
  • Assign the location that was just created to the desired workspace/device by choosing Management > Workspace in the Control Hub dashboard
  • Choose the desired workspace/device under the Overview tab and click on Assign Location.
  • Select the location and floor you wish to assign and click Save.

  • To prepare your workspaces to send telemetry to Cisco Spaces, you need to enable the below parameters on device configurations:
    • Ambient Noise Estimation
    • People Count Out Of Call
    • People Presence Detector
  • In the Webex Control Hub dashboard, choose Management > Locations
  • To enable environmental and other metrics on your selected device make sure to select your relevant device
  • Click on All configuration
  • Scroll down for Room Analytics and enable the required features
  • Ambient noise is the natural acoustics of the location where the technology is. To enable make sure the toggle is switched to On.
  • Click on Next > Apply.
  • For People Count Out Of Call make sure the toggle is switched to On. Click on Next > Apply
  • For People Presence Detector make sure the toggle is switched to On. Click on Next > Apply
  • Once Room Analytics parameters are enabled, all relevant info will be displayed in the Workspaces > Overview tab for that device, and on Rich Maps in the Cisco Spaces platform.

  • This integration allows telemetry from selected Webex Workspaces to be sent directly from Control Hub to your Cisco Spaces account.
  • In the Control Hub dashboard, choose Management > Workspaces.
  • Click the Integrations tab
  • On the Cisco Spaces app tile, click Details.
  • The Cisco Smart Workspaces app integration details window is displayed.
  • At the top-right corner of the window, click Activate.(note: you must be a full admin to see the button)
  • Review the API permissions requested and check the Terms and Conditions check box.
  • Click Activate.
  • Once Activated a token is generated that can be used to enable a cloud-to-cloud integration between Webex Control Hub and Cisco Spaces. (note: the token expires after 24 hours)
  • Use the Copy to Clipboard option to copy the activation code and paste the code in Cisco Spaces to integrate Cisco Webex.
  • Follow the next steps to paste the token in Cisco Spaces.
  • /ul>

  • Log into Cisco Spaces.
  • In the Cisco Spaces dashboard, choose Setup > Locations & Maps
  • Click on Import Locations.
  • Select the option Import location from Webex and click Next
  • In the Enter the activation token field, paste the Webex Control Hub token that was copied/generated from Step 5.3 above
  • Click Activate. A success message will be displayed if your token has not expired.

Note: the “green” activated state will only show for the Cisco Spaces admin that pasted the token in the field.

  • The Overview window displays the active sensors telemetry metrics for a selected location (all floors under the parent level) during a month.
  • It also displays the environmental data received from the active sensors as donut charts in the following sections:​
    • Air Quality: Indoor Air Quality (IAQ) score and other factors that affect the quality of the air. This section displays the following sensor types:
      • CO₂
      • TVOC
      • IAQ
      • Particulate Matter (PM2.5)
    • Ambient Noise: Floor noise levels.
    • Humidity: Humidity level of the floor.
    • Temperature: Temperature level of the floor.
  • To view the data for another floor or month:
    • From the Location drop-down list, select a location (building or campus).
    • From the Calendar drop-down list, select another month.
  • Click the icon to open the respective feature section to view additional parameters

Please take a moment to check if you’re able to successfully use the feature. Click on ‘yes’ to indicate it’s working. And on ‘Not yet’ if you need any assistance. ​