From ‘Good Enough’ to ‘Great’: The Evolution of Indoor Positioning
Indoor location technology has come a long way. Many of us started with RSSI-based positioning, measuring signal strength from our access points (APs) using either Wi-Fi or Bluetooth radios to triangulate device locations. While RSSI gets the job done for basic ‘which zone am I in?’ applications, its accuracy limitations become apparent when you need precise sub-meter asset tracking or navigation.
The Wi-Fi industry’s first answer was time-based ranging. Wi-Fi Fine Timing Measurement (FTM) brought Time-of-Flight measurements to the table, improving from RSSI-based techniques. By measuring the round-trip time of signals between devices and access points, FTM delivers the precision that RSSI simply can’t match.
But FTM has a scalability problem for dense deployments. In dense enterprise environments with hundreds of Wi-Fi devices, those ranging exchanges create airtime overhead. Each client needs multiple frame exchanges with several APs to get a position fix. When everyone’s trying to range, the result is increased overhead. It’s like trying to have precise conversations in a crowded room. Technically possible, but not practical at scale.
Because of the scalability challenge, we started to seek alternatives and that’s where Ultra-Wideband (UWB) emerges as the solution. Unlike Wi-Fi ranging, UWB changes the game entirely. UWB delivers both the sub-meter accuracy we need, and the scalability to handle enterprise deployments using Time Difference of Arrival (TDOA) techniques—a method that calculates position by measuring the tiny time differences between when signals arrive at multiple receivers. Whether using uplink TDOA (tags transmitting to synchronized anchors) or downlink TDOA (anchors broadcasting to devices), UWB sidesteps the collision issues that plague Wi-Fi ranging.

The Missing Piece: Getting UWB Deployment Right
However, our extensive field testing at Cisco revealed a critical deployment requirement that the industry has largely overlooked one that determines whether your UWB system delivers on its precision promises or fails in real-world conditions.
To characterize the relationship between Wi-Fi signal strength and UWB performance, we disabled Radio Resource Management (RRM) and set all APs to transmit at maximum power (23 dBm on 5 GHz in our testbed). This gave us consistent, controlled conditions where every AP operated at the same power level, allowing us to establish measurement baselines. Here’s what we discovered: When Wi-Fi signal strength drops below approximately -60 dBm RSSI, as measured by site survey equipment, UWB reception becomes consistently unreliable. Conversely, when Wi-Fi signal strength remains above -60 dBm RSSI, UWB measurement maintains reliable performance.
This discovery fundamentally changes how we need to think about AP deployment for location services. We can’t just deploy for Wi-Fi coverage anymore. We need to ensure adequate signal strength specifically for UWB performance.
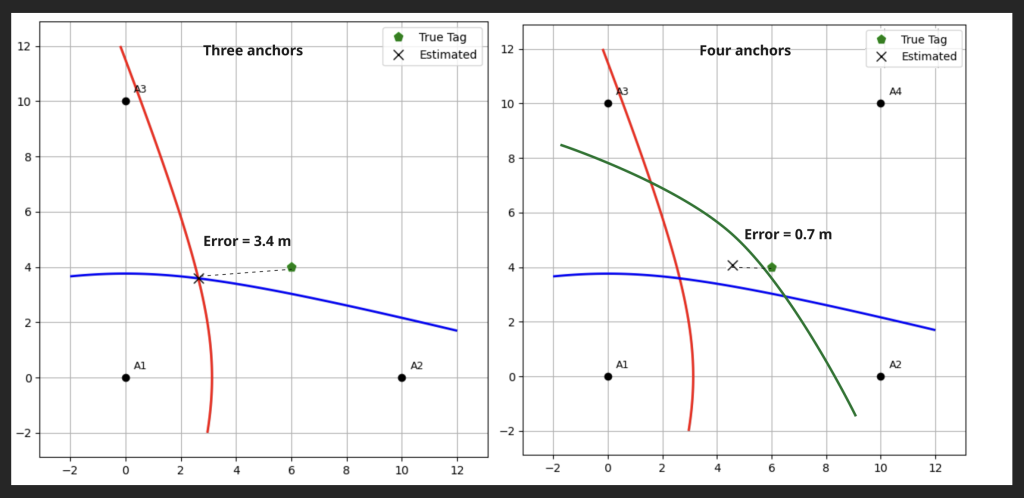
Additionally, unlike BLE RSSI (which requires 3 access points for trilateration) the nature of TDOA positioning means we need at least four anchors (access points) with good signal strength to any point on our floor map. Three anchors give us ambiguous results, while four anchors provide precision. This requirement stems from the fundamental geometry of hyperbolic multilateration.
A New Deployment Methodology
Based on these findings, we’ve developed a systematic approach to deploying APs for optimal UWB performance:
Step 1: Predictive Modeling with New Parameters
Just like traditional Wi-Fi deployments, start with deployment software and import floor plan CAD files. But here’s the difference: instead of planning for typical Wi-Fi coverage (-67 to -75 dBm) for one AP, model for -60 dBm RSSI coverage from 4 APs (assuming APs are at 23 dBm power in 5GHz, i.e. RRM is off). This ensures UWB will function reliably wherever precision tracking is needed. To elaborate, what you need to do is to import your floor plans and define wall materials with appropriate attenuation values (concrete, drywall, and glass all impact signal propagation differently). Modern site planning tools with applying Cisco’s provided changes allow you to model attenuation and simulate how building materials affect the -60 dBm coverage pattern from 4 or more APs.
Professional site planning tools now include features specifically helpful for this type of deployment. Both major platforms Ekahau and Hamina offer the ability to model for specific RSSI thresholds and visualize coverage from multiple APs simultaneously. Real-time heatmap updates show how placement adjustments affect the -60 dBm coverage requirement, while built-in vendor profiles ensure compatibility with your chosen hardware. Advanced 3D modeling capabilities account for building materials and architectural features that impact signal propagation, critical for accurate UWB coverage prediction.
Step 2: Deploy & Verify
Once deployment is complete based on the model, validation becomes critical. Tools like Hamina used along with Oscium Nomad, or Ekahau Sidekick can verify coverage, but here’s where Cisco has been leading the industry by working with partners to implement necessary updates. For example, Wi-Fi site planning and site survey tools typically use the strongest RSSI value at each location. For UWB deployment validation, we need them to use the four strongest 5G RSSI readings, confirming that RSSI readings from at least 4 APs exceed our -60 dBm threshold.
This -60 dBm threshold applies specifically to site survey measurements of Wi-Fi RSSI on 5 GHz channels for APs that are transmitting at 23 dBm TX power (i.e., RRM off). If RRM is on, the number needs to be adjusted accordingly.
Step 3: Fill the Gaps
Any location showing fewer than four APs above -60 dBm needs additional coverage. This might mean adding APs in areas where Wi-Fi-only deployments would consider coverage ‘good enough’. Post-deployment verification surveys should include walkthrough paths covering all critical areas where location services are required. Documenting your survey paths and measurement points for future reference as these baseline measurements will be invaluable for troubleshooting later on.
When deploying APs solely for connectivity and data, a general guideline is to install one AP for every 1,500 square feet, and there is no strict requirement to place APs along the perimeter. However, when designing for real-time location (RTLS), a similar AP density can be used, but it becomes important to position APs near the perimeter so that the entire floor plan lies within the ‘convex hull’ of the APs, ensuring better location accuracy across the entire coverage area.
In location deployments, the convex hull represents the smallest polygon that can enclose all anchor points used for locationing. For positioning accuracy, you need the devices to remain inside this convex hull rather than positioned at its edge or beyond it. When a client device or an asset tag moves outside the convex hull, multilateration or time difference of arrival based techniques experience increased errors substantially due to reduced angle diversity and worsening geometric dilution of precision.
For advanced location services, the deployment density increases to approximately one AP per 1,000 square feet in the middle of the building, again with APs placed along or as close to the perimeter as possible, ensuring that any point on the floor has a strong connection to at least four APs for optimal location precision.
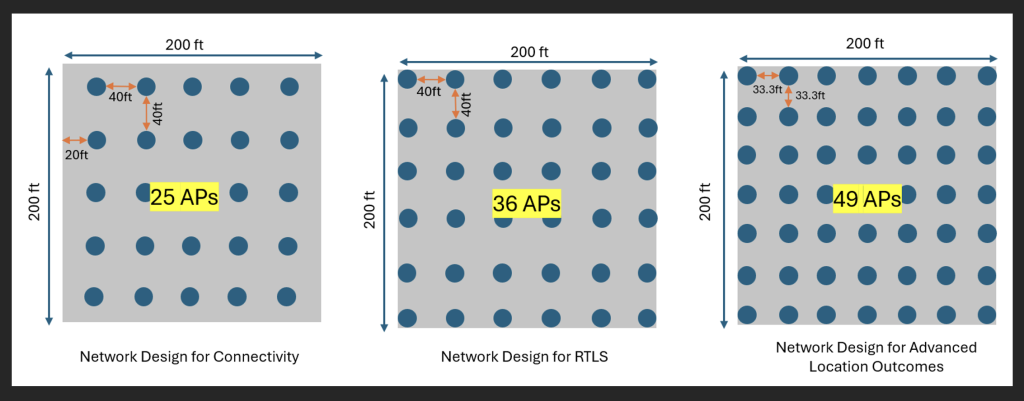
An example of AP deployment in a 200ft by 200 ft area is shown deploying 25 APs at roughly 40 ft intervals to meet basic connectivity needs. Increasing perimeter coverage to ensure the entire space lies within the convex hull of access points raises the count to 36 APs for RTLS, and spacing APs at about 33 ft intervals further increases density to 49 APs for advanced location accuracy.
When considering perimeters, the overall AP count varies depending on how the building is shaped. For example, in the Network Design for Advanced Location outcomes below, each AP in the middle of the building covers 1,000 square feet. The overall AP count is 49 for 40,000 square feet, not 40.
When you deploy APs densely for location services, you end up with some nice Wi-Fi wins too. Since each AP is handling fewer clients, there’s less fighting over airtime, which keeps connections reliable and responsive. You’re also sitting much closer to an AP, so you can actually take advantage of those Wi-Fi 7 speeds with 4K QAM instead of just reading about them in spec sheets. For anything that needs rock-solid low latency—think industrial robots or medical equipment—that proximity makes a difference. And here’s a bonus: when an AP goes down, you’ve got solid backup coverage already in place.
To put this into perspective and show how denser deployments help features like 4K QAM, here’s a simplified calculation. Consider a typical open office with Cisco 9178 access points ceiling-mounted at 9 feet in a standard 33-foot grid. With this spacing, 4K QAM works across most of the floor area on a 5 GHz 40 MHz channel, though it doesn’t connect 100% of the time due to real-world RF conditions. The math involves several key factors: 10 dBm transmit power (assumed because RRM will typically back off from the default 23 dBm in dense scenarios), about 4 dBi effective antenna gain from the AP’s down-tilt position at cell edge, and a 3 dB boost from MIMO diversity when the 4×4 AP connects to typical 2×2 smartphones. On the client side, phone antennas perform poorly—around -6 dBi gain when you’re actually holding the device due to body loading, plus another -3 dB in efficiency losses.
For thermal noise on a 40 MHz channel:
Thermal Noise = -174 dBm/Hz + 10·log10(40 × 10⁶ Hz) = -174 + 76 = -98 dBm.
At the cell edge, the link budget is:
Rx Signal = Tx Power + AP Antenna Gain + Client Antenna Gain + MIMO Gain + Efficiency Loss – Free Space Path Loss
= 10 + 4 + (–6) + 3 + (–3) – 64.0 = –55 dBm.
That gives SNR = –55.5 – (–98) = 42 dB, just shy of the 43 dB threshold needed for reliable 4K QAM.
When 4K QAM can’t maintain connection, devices automatically fall back to 1024-QAM, which works much more consistently across the coverage area. Spread the APs further apart and coverage drops significantly. At 40-foot spacing, you lose 4K QAM in about 15% of the area, mostly in the corners. At 50 feet, nearly 30% of your space relies on lower modulation schemes.
While the exact coverage percentages vary with interference, transmit power, transmit techniques, receiver design, and varying path loss in the real world, the improvement in 4K QAM coverage from denser deployments holds true and helps maximize your Wi-Fi 7 investment.
But the real payoff isn’t just about raw capacity. Dense deployments fundamentally change the user experience. Take that 200ft by 200ft area with 500 active Wi-Fi devices distributed evenly across the floor: instead of 20 devices on average competing for airtime on each of the 25 APs, you now have around half devices on average per AP when you bump up to 49 APs. That’s half the competition for every transmission opportunity, which means more consistent performance and fewer delays.
The Payoff: Location Services That Actually Work
Sure, deploying this many access points might seem like overkill if you are just thinking about basic Wi-Fi coverage. But in industrial environments, medical facilities, and many other places precision matters. When you are tracking assets down to several inches, guiding automated vehicles through tight spaces, or monitoring expensive equipment in real-time, you can’t afford connectivity gaps. It’s the difference between a system that works most of the time and one that never fails.
By understanding the relationship between Wi-Fi signal strength and UWB performance, and planning deployments accordingly, we can finally deliver on the promise of enterprise-grade, precision location services. No more dead zones. No more ‘it worked in the lab’ excuses. Just consistent, reliable, centimeter-accurate positioning wherever the business needs it.
The future of indoor location isn’t about choosing between technologies. It’s about deploying them correctly, so they work together seamlessly. With modern Cisco Wi-Fi 7 access points integrating UWB alongside traditional radios, we have the hardware. Now, with proper deployment methodology and with the Cisco Spaces platform for smart spaces, we have a complete blueprint for success.
It’s time to move beyond ‘good enough’ and build location services that deliver precision at scale.
For more information on deployment, indoor location services and/or smart spaces, reach us here.