Site Surveys
A predictive design tells us where UWB RTLS should work. A site survey tells us where it actually works, where it is marginal, and where the building physics had a different opinion.
In my previous post, Beyond Connectivity: Deploying for Location Success, I focused on a simple but important lesson: if we want UWB to deliver precision location at enterprise scale, we cannot design the network only for Wi-Fi connectivity. We need to design for the location outcome.
This follow-up is about the validation step. Even a good predictive design is still a prediction. It assumes the floor plan is correct, the wall materials are modeled accurately, the APs are installed where we planned them, and the building behaves the way our software model expects. Real buildings are rarely that cooperative.
That is why the post-installation survey matters. For UWB RTLS, it is the step that shows where the design is strong, where it is marginal, and where we need to fix the deployment before the customer depends on it.
The important shift: from coverage to computability
A Wi-Fi coverage heatmap answers one question: can a client connect here? That is necessary, but not sufficient for UWB DL-TDOA and UL-TDOA. A location system must answer a different question: can the system compute a stable position here?
That second question depends on more than signal strength from the best AP. It depends on whether enough APs can hear the tag (or enough APs can be heard by the phone, in the downlink case), whether those APs provide favorable spatial geometry, and whether the timing measurements are clean enough to solve the position. A location where the strongest AP looks excellent can still be weak for UWB if the fourth AP is too attenuated, blocked, or placed in a collinear arrangement that cannot resolve the position ambiguity.
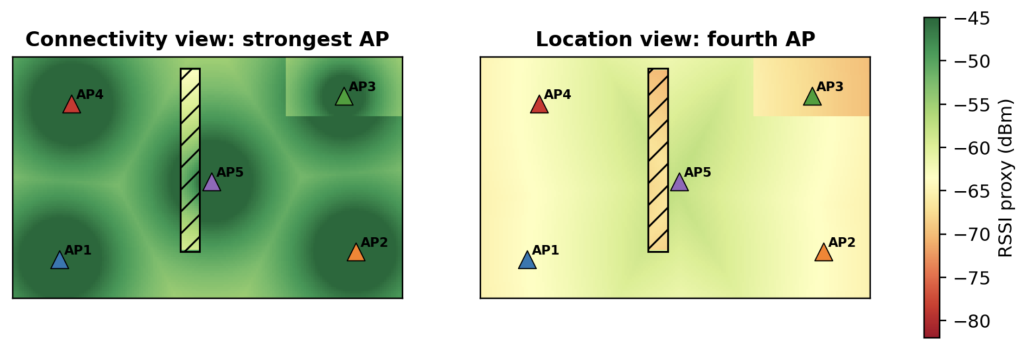
Figure 1. Wi-Fi view and location view: primary coverage can look healthy while the fourth-AP view exposes location risk.
Why anchor geometry matters
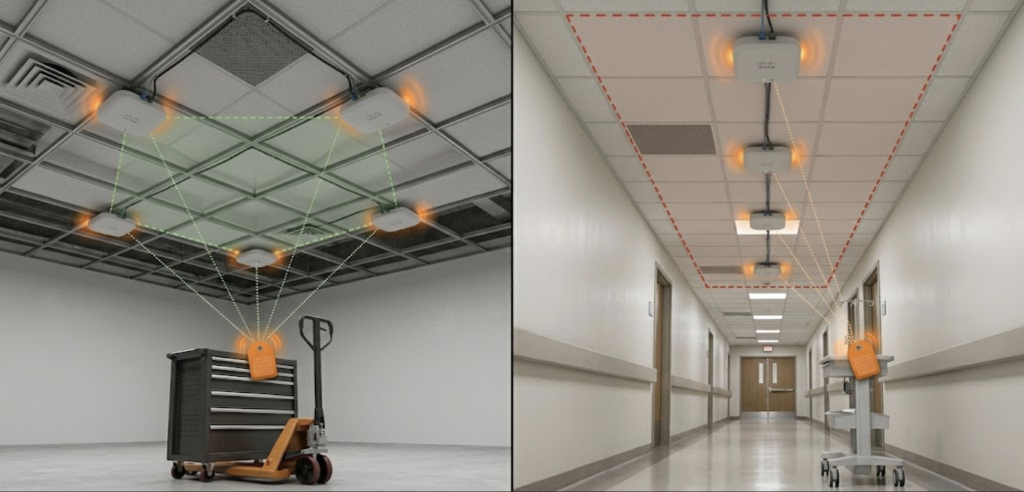
Figure 2. Anchor topology dictates tracking accuracy: convex anchor geometry keeps GDOP low, whereas linear hallway layouts amplify error.
This distinction is not unique to Cisco. Any multilateration system faces the same fundamental constraint: position accuracy is a function of anchor geometry and signal observability, not just signal strength to the nearest node. In TDOA, the solver estimates position from small differences in arrival time between pairs of anchors. Each time-difference measurement becomes a hyperbolic constraint, so both anchor count and geometry matter.
With three anchors, the solution can remain ambiguous or poorly conditioned. A fourth well-placed anchor adds an independent constraint and improves observability. But four APs only help if they provide angular diversity; a collinear or one-sided layout can still amplify error.
This amplification is Geometric Dilution of Precision, or GDOP. GDOP is the factor that turns ranging error into position error. A GDOP of 1.0 means a 10 cm ranging error stays about 10 cm at the position level; a GDOP of 4.0 turns the same 10 cm error into about 40 cm.
Where DDM fits
Cisco Spaces Design and Deployment Module, or DDM, should not be positioned as a replacement for Ekahau, Hamina, or the site survey. The better framing is that DDM helps connect a planned or existing AP design to the intended Cisco Spaces outcome.
The DDM FAQ describes it as a companion tool for validating network design and deployment guidance for smart spaces use cases, including precise location, asset tracking, indoor navigation, and occupancy analytics. It also explicitly says customers and partners should continue their post-deployment AP design validation using active/passive site surveys in Ekahau or Hamina for Wi-Fi performance and RTLS requirements.

Figure 3. DDM fits as a design and outcome-readiness validation step. The physical site survey still validates the installed RF reality.
Designing for advanced location usually increases AP density. That is good for location geometry, and it can also improve Wi-Fi experience by reducing client distance to the AP. But density has to be managed. More APs also means more care around channel reuse, power, and co-channel interference.
What the predictive model cannot know
Predictive design is still the right place to start. Tools like Ekahau and Hamina let us import CAD files, define wall materials, place APs, and simulate how the network should behave before anyone climbs a ladder. That is essential. But a predictive design has blind spots by definition.
- An AP may be moved a few feet during installation to avoid HVAC, conduit, sprinklers, lighting, or a concrete beam. That may not matter much for Wi-Fi connectivity, but it can change TDOA geometry.
- A wall modeled as drywall may contain metal studs, wire mesh, foil-backed insulation, dense concrete, glass, or shelving that changes propagation.
- Warehouses, hospitals, and manufacturing floors change after deployment. Inventory, carts, medical equipment, and machinery create new RF shadows.
- A floor plan may be accurate in two dimensions but incomplete in the vertical dimension. Ceiling height, mounting orientation, and obstructions above the ceiling line can matter.
This is why I prefer to describe the survey as the reality check. It does not compete with predictive design. It completes it.
How to read Ekahau, Hamina, and Cisco UWB surveys together
For UWB RTLS validation, the goal is not simply to prove that there is Wi-Fi signal. The goal is to prove that enough APs are available above the required threshold, in the right places, across the areas where the business expects location to work.
One practical approach to validation is to use existing Wi-Fi design and survey tools to approximate UWB coverage. Walls, floors, ceilings, and obstructions affect both signals according to the same electromagnetic principles.
Cisco has analyzed RF patterns from APs across multiple installation environments to determine whether UWB coverage can be correlated with Wi-Fi coverage. The core finding is that in a typical office environment, UWB coverage from a Cisco CW9176 or CW9178 AP correlates with Wi-Fi 5 GHz coverage at a specific RSSI cutoff. The approximate relationship is a 73 dB difference between AP transmit power and the RSSI threshold that marks the edge of usable UWB coverage.
For example, at 14 dBm transmit power, the equivalent Wi-Fi RSSI cutoff falls in the range of approximately -56 to -62 dBm. In tools like Ekahau or Hamina, this means looking beyond primary coverage and using the RSSI cutoff corresponding to UWB coverage to understand whether the fourth AP is strong enough across the required areas.
The Wi-Fi proxy methodology and the native Cisco UWB survey workflow should be viewed together as complementary validation approaches.
In Ekahau, that means looking beyond primary coverage and using deeper coverage layers or RTLS-oriented reporting to understand whether the fourth AP is strong enough in the required areas. In Hamina, a “number of APs” style heatmap aligns naturally with the problem because it changes the question from “how strong is the best AP?” to “how many APs can be heard above this threshold?”
The result is much more actionable than a generic green heatmap. The survey can show where the deployment is healthy, where the fourth AP falls below the threshold, where AP geometry is poor, and where additional APs or placement changes are needed.
Figure 4 shows the Wi-Fi proxy view. The question is not only whether one AP is strong; it is whether at least four APs remain above the selected threshold across the business-critical areas.
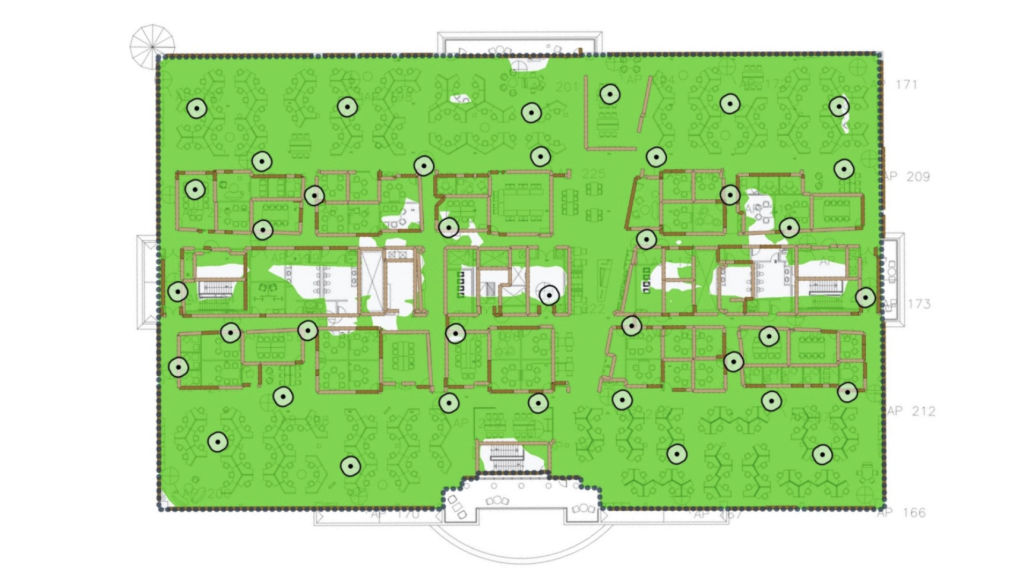
Ekahau Wi-Fi Survey >= 4 APs @ -60 dBm Rx, 5 GHz
Figure 4. Ekahau site survey of a Cisco office floor, showing areas where at least four APs are received at or above -60 dBm on 5 GHz. Green indicates the four-AP threshold is met. White gaps expose areas where TDOA geometry may be insufficient for reliable UWB positioning.
Cisco UWB survey: direct measurement
While Wi-Fi proxy models get us close, direct measurement remains the gold standard. Cisco is adding a dedicated UWB site survey capability that integrates directly into the Cisco Spaces cloud map.
This functionality allows engineers to measure and validate UWB propagation directly in the deployment environment. Using a UWB radio to capture actual UWB measurements, the output is shown natively on the Spaces map, right alongside the Wi-Fi site survey data that may already be imported from tools like Ekahau or Hamina.
The tool uses Two-Way Ranging (TWR) to measure UWB coverage, ensuring bidirectional communication between the external module and the APs. This means the survey validates coverage for both asset tracking (uplink) and wayfinding (downlink) use cases in a single measurement pass.
Figure 5 should be read alongside Figure 4: the Wi-Fi proxy shows where UWB should work, while the Cisco UWB survey uses a real UWB radio to show where it works, where it is marginal, and where an AP move or addition may be needed.
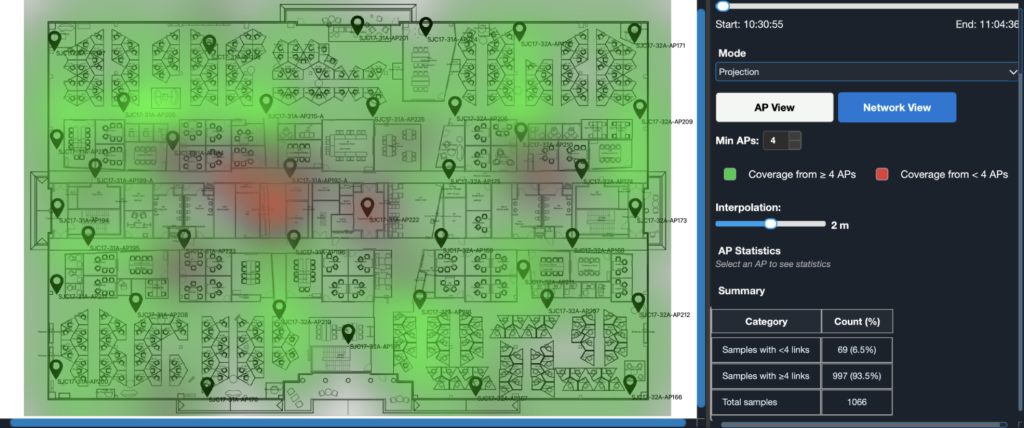
Cisco UWB Survey Tool – Projection Mode, Coverage from >= 4 APs
Figure 5. Cisco UWB Survey Tool view of the same validation workflow using UWB TWR measurements. The native UWB measurement helps confirm where the Wi-Fi proxy estimate is accurate, where coverage is marginal, and where AP placement should change.
What a good UWB RTLS validation survey should answer
A location-grade validation survey will produce more than a pretty heatmap. It should answer practical deployment questions:
- Where do at least four APs meet the required signal threshold for UWB TDOA proxy validation?
- Where does the anchor geometry create a high-risk area even though RF signal looks acceptable?
- Are there physical obstructions or materials that explain unexpected gaps?
- Which areas are ready for precision UWB, which areas should rely on BLE-UWB fusion, BLE, or lower-precision fallback, and which areas require redesign?
This is the practical value of the site survey: it gives the engineering team a map of confidence. Not just coverage. Confidence.